-
about
-
products
-
customer support
-
careers
-
investors
-
newsroom
-
Languages
- MyLam

Blog
- Virtual twins and machine learning (ML) offer a faster, lower-cost way to identify systemic yield issues as DRAM manufacturing grows more complex.
- By calibrating a SEMulator3D® virtual twin with silicon data, engineers can model process variation, detect multiple failure modes, and evaluate solutions with less wafer experimentation.
- ML-based optimization reduced all eight systemic failure modes and improved predicted yield from 0.1% to 78.5%.
As memory technologies continue to scale, manufacturing processes are becoming increasingly complex.
- Additional process steps, tighter process windows, and new sources of variation are making it progressively more challenging to reach acceptable yield.
Systemic failures are emerging as a source of yield loss during yield ramp. Unlike random defects, these failures are often driven by complex interactions between multiple process modules.
Rapid root-cause identification of these systemic defects is critical to quickly improving yield and accelerating time-to-market.1 But conventional failure analysis relies heavily on wafer experimentation and statistical analysis, which can be slow and costly as manufacturing complexity increases.
That’s where calibrated virtual twins and machine-learning optimization can help.
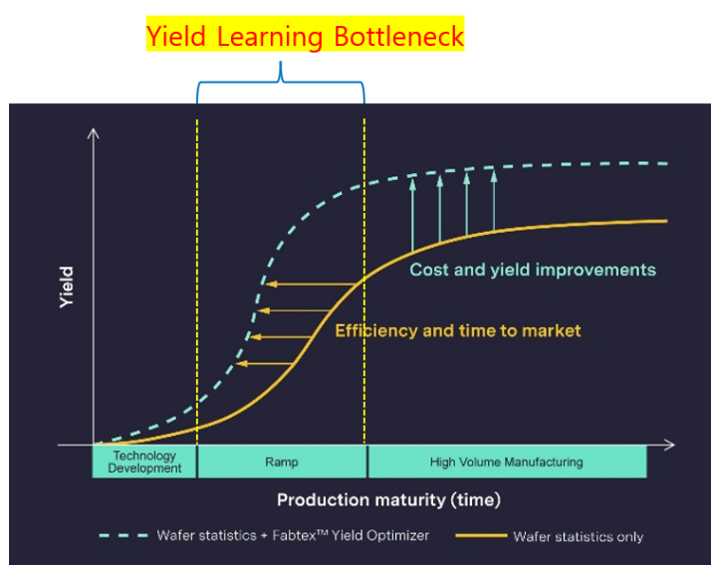
Figure 1. Systemic failures are a key bottleneck during yield ramp. Faster identification and reduction of these failures can accelerate the yield ramp and shorten the time required to reach a targeted manufacturing yield.
Process engineers use virtual manufacturing models (SEMulator3D®) with machine learning (ML) optimization (Fabtex™ Yield Optimizer) to predict process failures.
- A virtual twin can improve DRAM yield analysis by reproducing process variation in a calibrated digital environment.
- ML can then evaluate multiple failure mechanisms and process changes simultaneously.
Using this technique, engineers can evaluate potential yield improvements, all with limited need for wafer-based experimentation.
Detecting Multiple DRAM Failure Modes with Virtual Metrology
As an example of this technique, we built a SEMulator3D model (virtual twin) of a DRAM manufacturing process sequence. During this model-building, we established virtual metrology measurements throughout the process sequence (Figure 2).
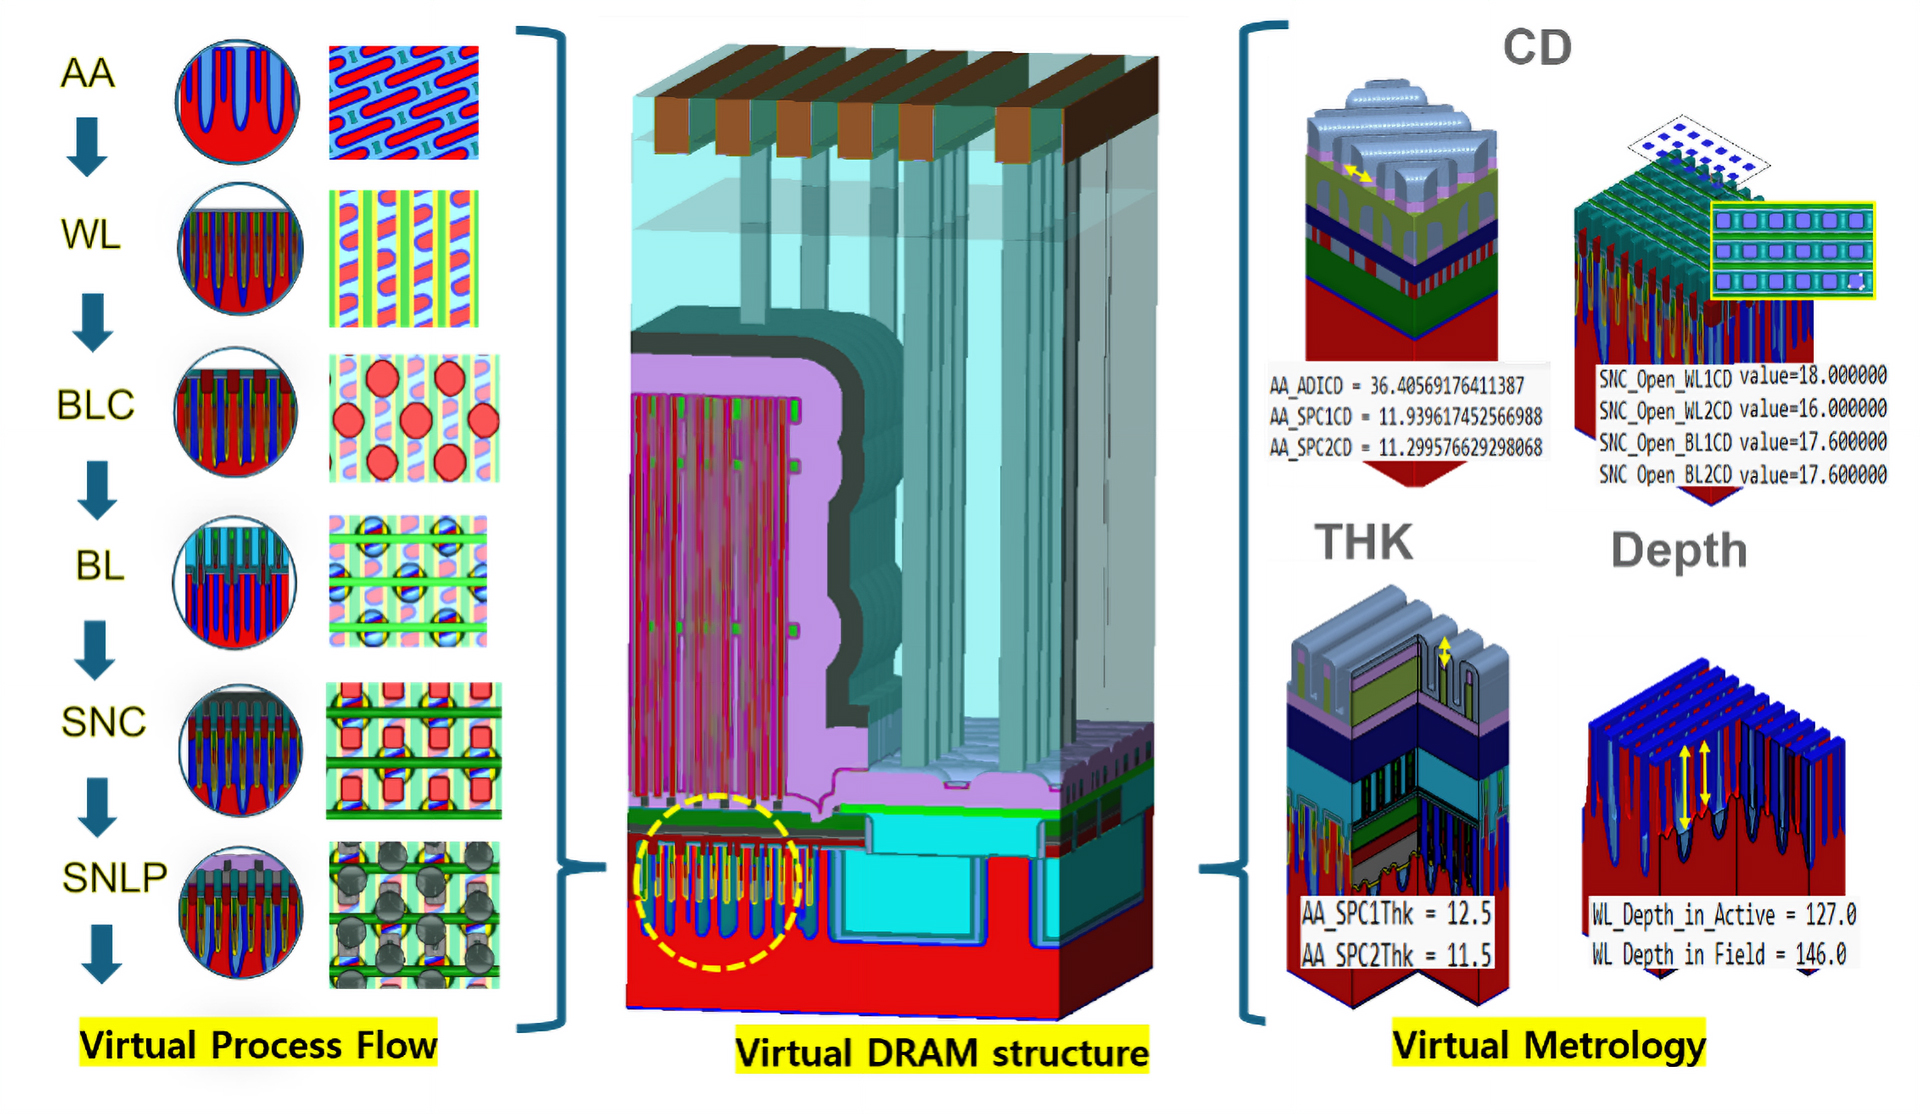
Figure 2. Building and calibrating a DRAM virtual twin using process integration, virtual metrology, and silicon data.
ML was then used to calibrate the model against silicon data, enabling the virtual environment to better reproduce observed manufacturing behavior and serve as the foundation for downstream failure analysis and optimization.
Building and Calibrating a DRAM Virtual Twin
For our specific case study, we built a calibrated virtual twin for our DRAM memory device that contained eight known systemic failure mechanisms.
Figure 3 displays examples of these failure mechanisms, including shorts, opens, and overlap-related defects between critical DRAM structures.
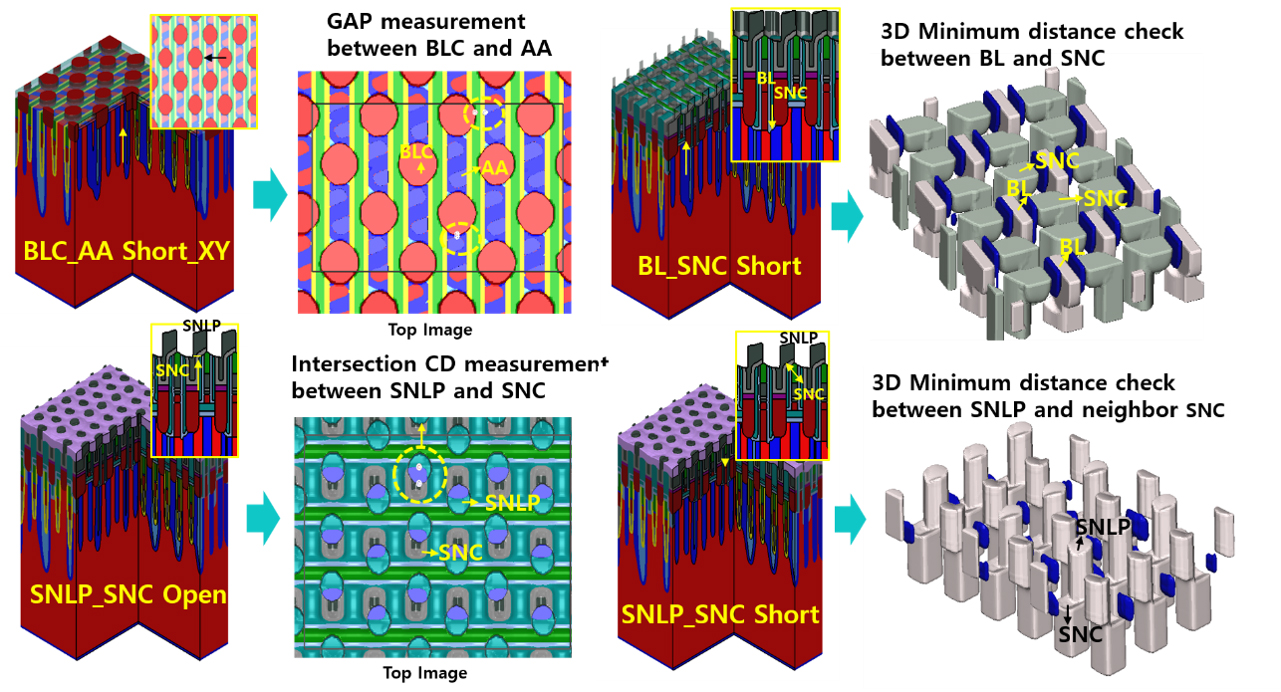
Figure 3. Reproducing systemic DRAM failure modes and detecting them using virtual metrology.
We also specified (in the virtual twin) the virtual metrology needed to detect these failures. By translating each failure into a measurable geometric condition and monitoring it through virtual metrology, we were able to automatically detect and simultaneously analyze multiple failure mechanisms within a single study.
Using Machine Learning to Optimize Process Targets
Using the calibrated virtual twin, ML was then applied to help us understand the impact of process and structural variations on the eight predefined failure modes.
We then searched for an optimized manufacturing solution (specific process changes) that provided the lowest failure rate across our eight predefined failure modes. Instead of addressing each failure mode independently, the optimization routine evaluated the impact of multiple process changes simultaneously and searched for process targets that improved the overall pass ratio.
Case Study Results: Predicted Yield Increased to 78.5%
As shown in Figure 4, the optimized process settings significantly reduced all eight systemic failure modes.
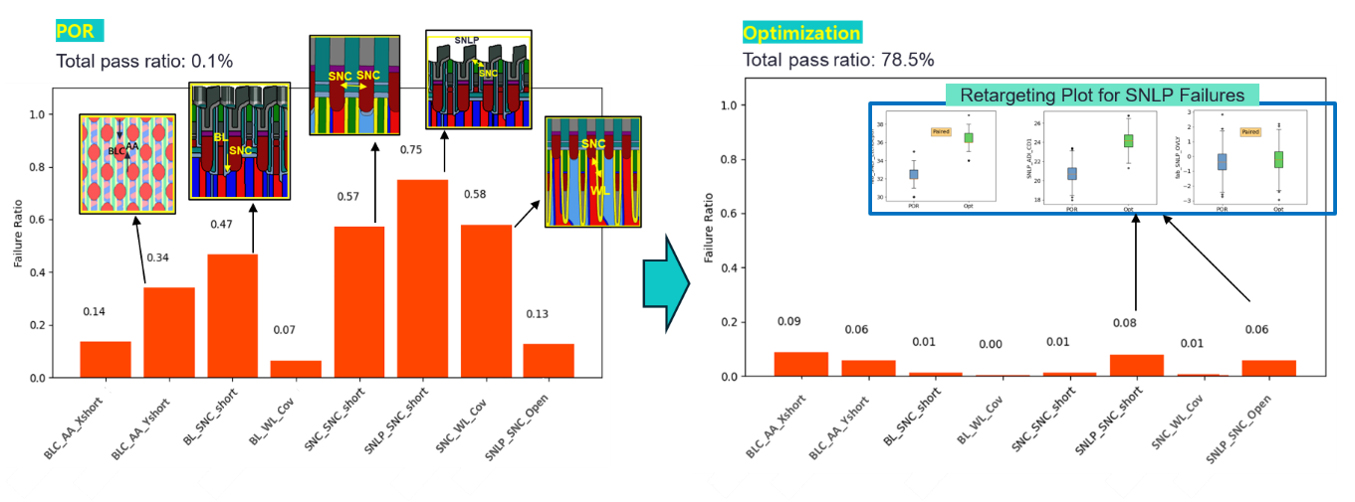
Figure 4. Simultaneous reduction of multiple systemic failures through ML-based optimization and retargeting analysis. A sample retargeting plot for SNLP (storage node landing pad) open/short failures is highlighted.
Under the nominal process conditions used in the study, the predicted total yield was 0.1%. Following optimization, the predicted yield increased to 78.5%, with lower failure rates across all eight failure mechanisms.
This analysis also translated the optimized solution into actionable inline fab targets that can be directly applied in the real process, helping engineers identify which process and structural parameters should be adjusted to further reduce systemic failures.
Accelerating Semiconductor Yield Improvement
This work demonstrates how the combination of process models and ML can be used to accelerate yield improvement during DRAM device development. By reproducing process variability in a calibrated virtual environment, and performing simultaneous optimization and retargeting, engineers can detect multiple device failures and investigate a broad solution space without the time and cost of extensive silicon experimentation.
Reference
1 I. Tirkel, "Yield Learning Curve Models in Semiconductor Manufacturing," IEEE Transactions on Semiconductor Manufacturing, vol. 26, no. 4, pp. 564-571, Nov. 2013.